


Editor's Note: This story originally appeared on Trace One.
Public sentiment toward the economy is significantly impacted by inflation rates. One of the spending categories where consumers have faced the greatest pressure from price increases is groceries.
Since the onset of the COVID-19 pandemic, food prices have surged at their fastest rate since the 1970s.
While the pace of increase has moderated since then, grocery prices remain at historically high levels, adding considerable strain to household budgets.
This upward trend in food costs is particularly concerning for families on tight budgets, as food expenses represent a non-negotiable necessity. Unlike discretionary spending, which can be trimmed in times of financial strain, expenditures on groceries are essential and cannot easily be reduced.
Here are the grocery store items that have increased the most in price. Find details on the methodology at the end.
1. Eggs

- Change in price since March 2020: +50.0%
- Two-year change in price: +27.1%
- One-year change in price: -6.8%
2. Beef roasts

- Change in price since March 2020: +40.0%
- Two-year change in price: +6.5%
- One-year change in price: +11.2%
3. Flour
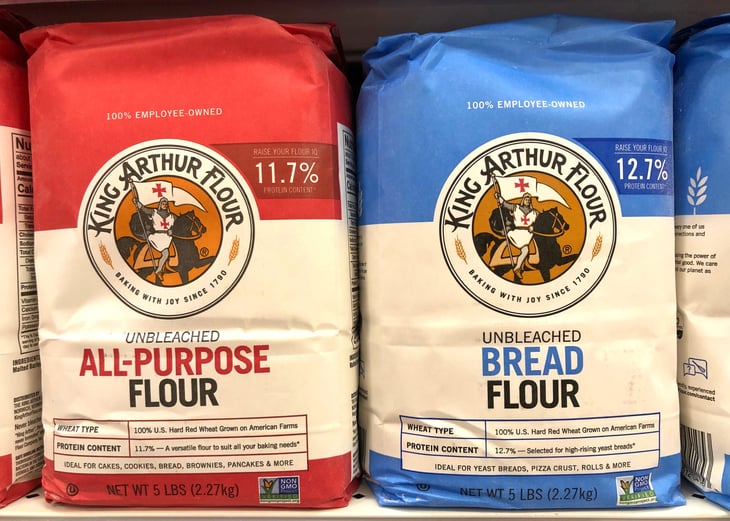
- Change in price since March 2020: +36.0%
- Two-year change in price: +17.3%
- One-year change in price: -0.2%

4. Sugar & substitutes

- Change in price since March 2020: +34.9%
- Two-year change in price: +19.1%
- One-year change in price: +5.6%
5. Beef steaks

- Change in price since March 2020: +32.6%
- Two-year change in price: +6.6%
- One-year change in price: +7.2%
6. Carbonated drinks

- Change in price since March 2020: +32.1%
- Two-year change in price: +16.4%
- One-year change in price: +4.2%
7. Fruits & vegetables (canned)

- Change in price since March 2020: +31.6%
- Two-year change in price: +13.1%
- One-year change in price: +2.7%
8. Salad dressing

- Change in price since March 2020: +31.5%
- Two-year change in price: +16.0%
- One-year change in price: -0.4%
9. Biscuits, rolls & muffins

- Change in price since March 2020: +31.4%
- Two-year change in price: +13.3%
- One-year change in price: +2.6%
10. Butter & margarine

- Change in price since March 2020: +29.4%
- Two-year change in price: +14.8%
- One-year change in price: -2.1%
11. Chicken

- Change in price since March 2020: +29.2%
- Two-year change in price: +8.7%
- One-year change in price: +2.0%
12. Juices
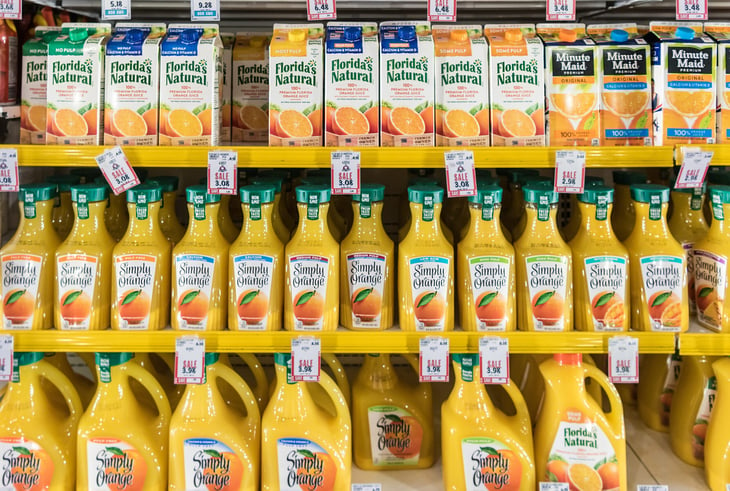
- Change in price since March 2020: +27.9%
- Two-year change in price: +14.9%
- One-year change in price: +2.7%
13. Cakes, cupcakes & cookies

- Change in price since March 2020: +27.6%
- Two-year change in price: +15.8%
- One-year change in price: +0.2%
14. Fruits & vegetables (frozen)

- Change in price since March 2020: +27.4%
- Two-year change in price: +14.0%
- One-year change in price: -0.9%
15. Lettuce

- Change in price since March 2020: +27.3%
- Two-year change in price: +7.2%
- One-year change in price: +5.8%
Methodology

Data sources include the U.S. Bureau of Labor Statistics (BLS) March 2024 Consumer Price Index, U.S. Bureau of Economic Analysis (BEA) 2022 Personal Consumption Expenditures by State (released October 2023), and U.S. Census Bureau 2023 Household Pulse Survey.
To determine the grocery store items that increased the most in price, researchers calculated the percentage change in CPI between March 2020 and March 2024 across the most common grocery (food at home) items.
Researchers also calculated the two-year change in CPI between March 2022 and March 2024, as well as the one-year change in CPI between March 2023 and March 2024.
State-level data on grocery spending was sourced from the BEA and Census Bureau.
The share of total consumer spending allocated to groceries for each state was calculated by dividing the per-capita spending on food and beverages purchased for off-premises consumption by the total per-capita personal consumption expenditures.
Total weekly grocery spending by state and household size simply represents self-reported data collected and provided by the Household Pulse Survey.
Add a Comment
Our Policy: We welcome relevant and respectful comments in order to foster healthy and informative discussions. All other comments may be removed. Comments with links are automatically held for moderation.