
Editor's Note: This story originally appeared on Captain Experiences.
Fishing is among the nation’s most popular pastimes, with more than 50 million Americans going fishing each year.
The sport is enjoyable for participants of all ages and athletic abilities, easy to learn, and offers time to relax and enjoy nature, making it a great hobby for people from all walks of life.
Fishing has long been popular among Americans, but in more recent decades, the growth of fishing has also become an important component of conservation and habitat restoration efforts in the U.S. Revenue derived from fishing licenses helps finance federal, state, and local programs for wildlife protection.
State agencies directly use license revenue to fund wildlife agencies, while federal programs often use the volume of licenses sold per state as part of the basis for apportionments of federal wildlife funds. Governments also frequently generate revenue related to fishing in other ways as well, such as excise taxes on angling equipment.
In recent history, some U.S. states have seen more rapid growth in the popularity of fishing than others.
The following is a breakdown of fishing license growth by state. The analysis was conducted by Captain Experiences using data from the U.S. Fish & Wildlife Service. For more information, refer to the methodology section at the end.
1. Massachusetts
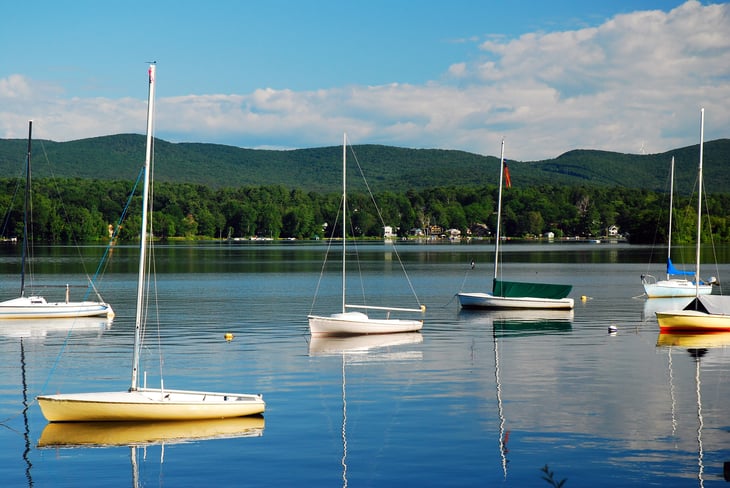
- 5-year change in fishing license holders per capita: +55.3%
- 10-year change in fishing license holders per capita: +31.5%
- 5-year change in fishing license revenue: +27.3%
- 10-year change in fishing license revenue: +15.2%
- Total fishing license holders: 273,849
- Annual fishing license revenue: $6,947,055
2. Nevada

- 5-year change in fishing license holders per capita: +46.6%
- 10-year change in fishing license holders per capita: +18.4%
- 5-year change in fishing license revenue: +37.9%
- 10-year change in fishing license revenue: +24.3%
- Total fishing license holders: 162,548
- Annual fishing license revenue: $5,473,787
3. Rhode Island
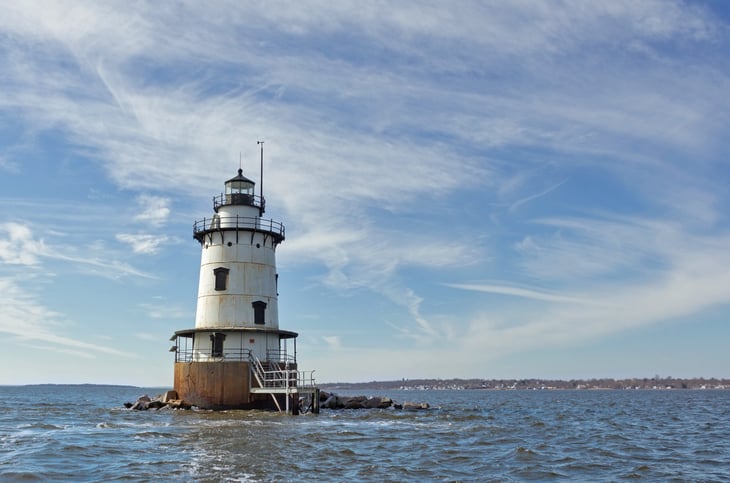
- 5-year change in fishing license holders per capita: +44.5%
- 10-year change in fishing license holders per capita: +286.9%
- 5-year change in fishing license revenue: -17.1%
- 10-year change in fishing license revenue: +65.8%
- Total fishing license holders: 96,703
- Annual fishing license revenue: $878,138
4. Maine

- 5-year change in fishing license holders per capita: +28.2%
- 10-year change in fishing license holders per capita: +31.2%
- 5-year change in fishing license revenue: -4.0%
- 10-year change in fishing license revenue: -0.6%
- Total fishing license holders: 367,124
- Annual fishing license revenue: $9,394,339
5. West Virginia

- 5-year change in fishing license holders per capita: +27.3%
- 10-year change in fishing license holders per capita: +36.1%
- 5-year change in fishing license revenue: -7.7%
- 10-year change in fishing license revenue: -14.1%
- Total fishing license holders: 319,178
- Annual fishing license revenue: $6,203,706
6. Colorado
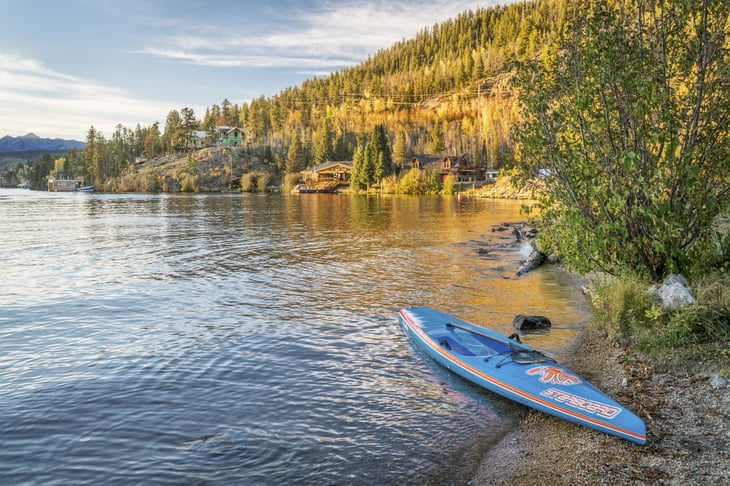
- 5-year change in fishing license holders per capita: +18.3%
- 10-year change in fishing license holders per capita: +27.3%
- 5-year change in fishing license revenue: +44.6%
- 10-year change in fishing license revenue: +56.3%
- Total fishing license holders: 949,595
- Annual fishing license revenue: $29,928,665
7. Georgia

- 5-year change in fishing license holders per capita: +13.1%
- 10-year change in fishing license holders per capita: +61.6%
- 5-year change in fishing license revenue: +19.0%
- 10-year change in fishing license revenue: +38.3%
- Total fishing license holders: 1,114,640
- Annual fishing license revenue: $15,747,703
8. Washington
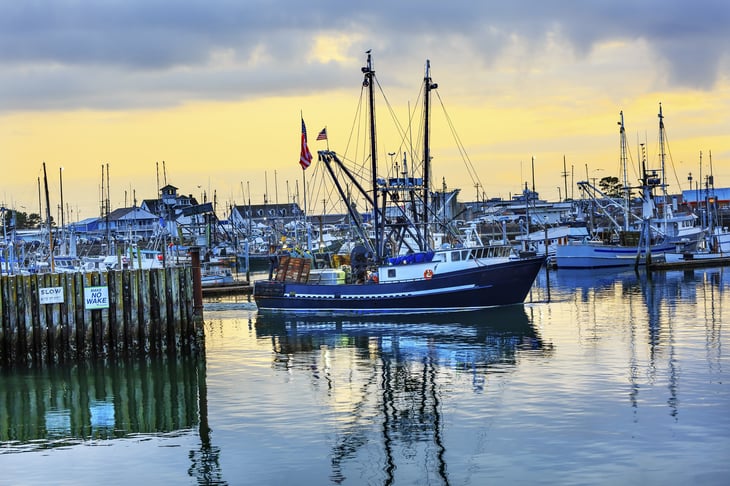
- 5-year change in fishing license holders per capita: +12.1%
- 10-year change in fishing license holders per capita: -7.8%
- 5-year change in fishing license revenue: +6.7%
- 10-year change in fishing license revenue: +3.3%
- Total fishing license holders: 716,371
- Annual fishing license revenue: $37,046,370
9. Arkansas
- 5-year change in fishing license holders per capita: +11.1%
- 10-year change in fishing license holders per capita: -18.0%
- 5-year change in fishing license revenue: +2.2%
- 10-year change in fishing license revenue: -8.5%
- Total fishing license holders: 549,773
- Annual fishing license revenue: $9,923,689
10. New Hampshire

- 5-year change in fishing license holders per capita: +10.9%
- 10-year change in fishing license holders per capita: +13.0%
- 5-year change in fishing license revenue: -3.2%
- 10-year change in fishing license revenue: +11.2%
- Total fishing license holders: 180,404
- Annual fishing license revenue: $7,402,413
11. New Jersey

- 5-year change in fishing license holders per capita: +9.6%
- 10-year change in fishing license holders per capita: +6.9%
- 5-year change in fishing license revenue: +0.8%
- 10-year change in fishing license revenue: -9.2%
- Total fishing license holders: 194,128
- Annual fishing license revenue: $5,791,962
12. Indiana

- 5-year change in fishing license holders per capita: +8.4%
- 10-year change in fishing license holders per capita: +21.2%
- 5-year change in fishing license revenue: -14.4%
- 10-year change in fishing license revenue: -16.9%
- Total fishing license holders: 570,322
- Annual fishing license revenue: $7,874,092
13. Kansas

- 5-year change in fishing license holders per capita: +7.6%
- 10-year change in fishing license holders per capita: +11.6%
- 5-year change in fishing license revenue: -15.1%
- 10-year change in fishing license revenue: +16.0%
- Total fishing license holders: 290,068
- Annual fishing license revenue: $6,689,831
14. Tennessee

- 5-year change in fishing license holders per capita: +7.0%
- 10-year change in fishing license holders per capita: +14.4%
- 5-year change in fishing license revenue: +94.8%
- 10-year change in fishing license revenue: +106.8%
- Total fishing license holders: 982,700
- Annual fishing license revenue: $43,678,425
15. New Mexico

- 5-year change in fishing license holders per capita: +6.4%
- 10-year change in fishing license holders per capita: +41.8%
- 5-year change in fishing license revenue: +20.7%
- 10-year change in fishing license revenue: +26.2%
- Total fishing license holders: 263,422
- Annual fishing license revenue: $8,335,016
Methodology

The data used in this analysis is from the U.S. Fish & Wildlife Service’s Hunting & Fishing Licenses Data. The latest data shown is for apportionment year 2024, which reflects license sales that occurred in 2022.
To determine the states where fishing popularity has grown the most, researchers calculated the percentage change in the number of fishing license holders per capita over the last five years. In the event of a tie, the location with the greater 10-year change in fishing licenses per capita was ranked higher.
This information only includes paid licenses that meet the requirements of the Dingell-Johnson Sport Fish Restoration Act. The data is not representative of individuals who obtain free licenses or who are not required to hold licenses.


Add a Comment
Our Policy: We welcome relevant and respectful comments in order to foster healthy and informative discussions. All other comments may be removed. Comments with links are automatically held for moderation.